COMPARING BIG TEN AND SEC VOLUME IN THE NFL DRAFT: 1990-2014
In my last diary, someone brought up a question regarding how the numbers present there for the Big Ten might compare to the numbers of the SEC over the same period. This particular diary shall endeavor to explore that question.
Fortunately, this was a relatively easy thing to do, thanks to the site DraftHistory.com, which has not only the year-by-year data but also round and position for each player. A future diary will likely take a specific team or two – Michigan being one of them – and attempt to devise a weighting system which will account for where the bulk of the players were taken in the draft and not simply look at how many came from a given team.
So, basically, I did a similar summary to start as in the Big Ten diary:
TEAM | AVG. | % OF TOTAL | NO. OF PLAYERS |
TENNESSEE | 5.28 | 11.78% | 132 |
FLORIDA | 5.12 | 11.42% | 128 |
GEORGIA | 4.64 | 10.35% | 116 |
LSU | 4.52 | 10.08% | 113 |
ALABAMA | 4.48 | 9.99% | 112 |
TEXAS A&M | 3.88 | 8.65% | 97 |
AUBURN | 3.38 | 7.49% | 84 |
SOUTH CAROLINA | 2.56 | 5.71% | 64 |
ARKANSAS | 2.36 | 5.26% | 59 |
MISS. STATE | 2.28 | 5.08% | 57 |
OLE MISS | 1.96 | 4.37% | 49 |
MISSOURI | 1.64 | 3.66% | 41 |
KENTUCKY | 1.60 | 3.57% | 40 |
VANDERBILT | 1.16 | 2.59% | 29 |
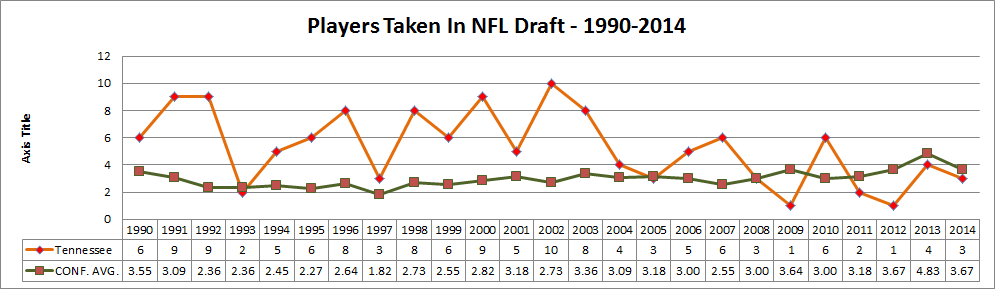
That is not a misfire in Excel. Those of us old enough to remember when Tennessee was hot shit in a good way, if you will, know exactly why they are there on the top. The 1990s were extremely kind to Tennessee, and the early 2000s were pretty pleasant for them as well.
In some way, however, Big Ten and SEC success in terms of the number of players sent has been similar. For starters, the SEC has only sent 30 more players in total over 25 years, and as with the Big Ten, the five most prolific contributors account for about half of the entire conference total. What does that show? Conference will be conferences and there will always be an upper tier of teams that enjoy longer periods of sustained success than others.
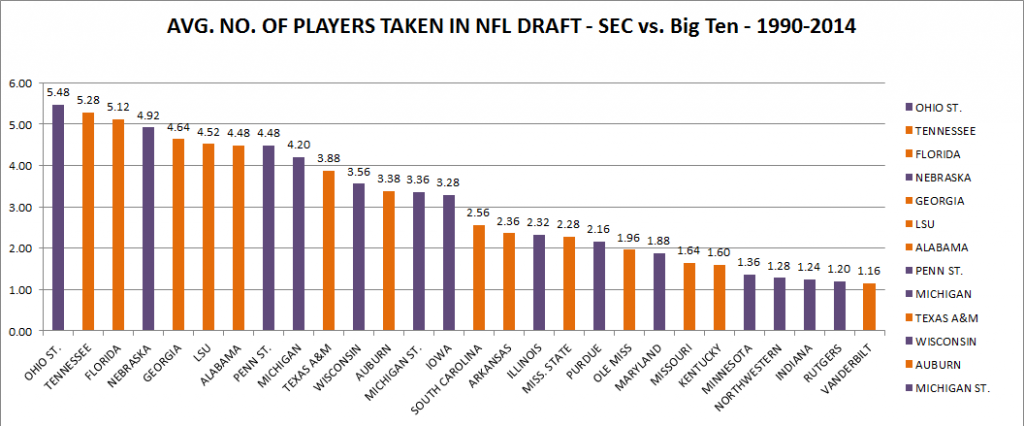
As you might note in the graphs below, the mix between the Big Ten and the SEC shows a fair number of SEC teams clustering towards the top and quite a few Big Ten teams closer to the middle in this comparison. I will admit that this is what I thought might happen, so it didn’t shock me. In terms of volume contribution, however, the Big Ten still comes out on top with Ohio State sending 5.48 players per year on average, with Nebraska (admitted a late-comer to the Big Ten) in fourth at 4.92 players per year on average. Michigan rings in at 9th overall in this comparison, which is still a decent showing at 4.20 players per year.
Here’s the yearly average:
Here’s the total contribution over 25 years:
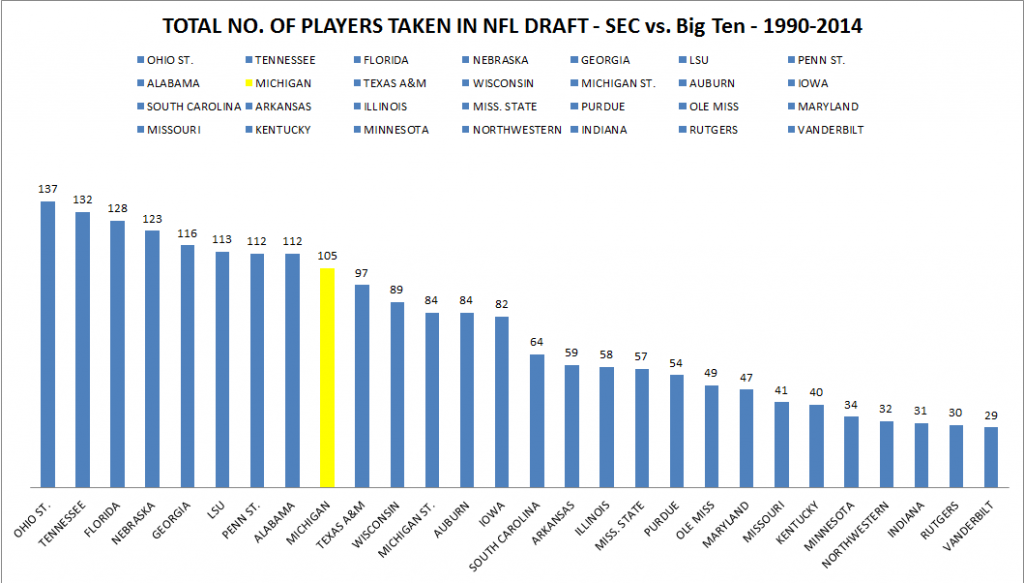
If you want to go to the NFL, don’t go to Vanderbilt….or Rutgers for that matter.
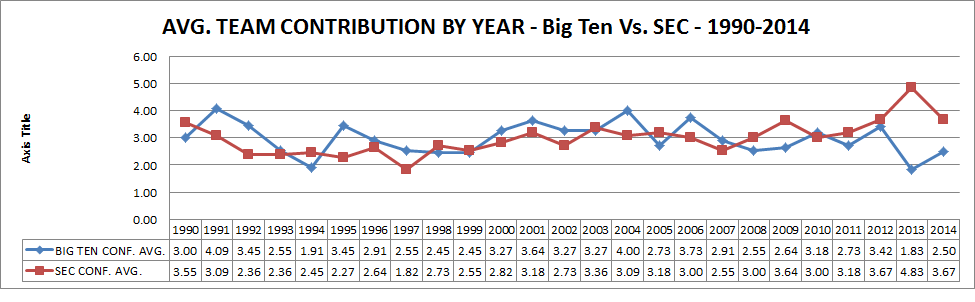
Here is the grand average for the SEC and Big Ten compared year-to-year. The differential between the averages has resulted in a net positive for the Big Ten on 13 occasions, although typically not by much. In other words, the two conference were rather competitive on a volume basis for talent sent to the NFL in this period.
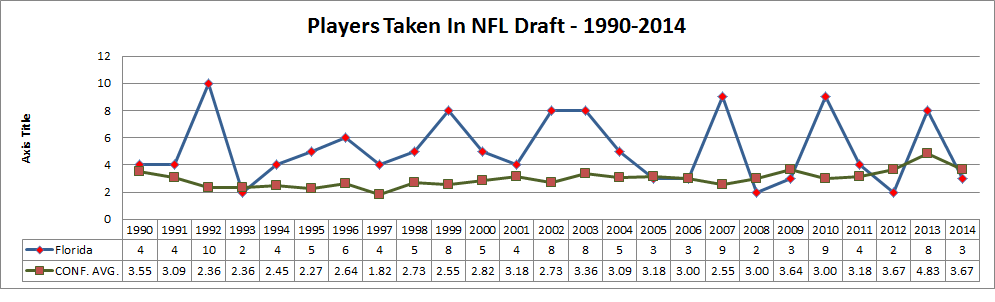
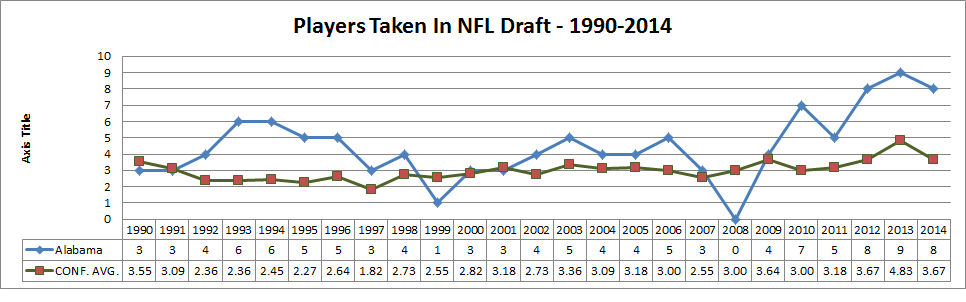
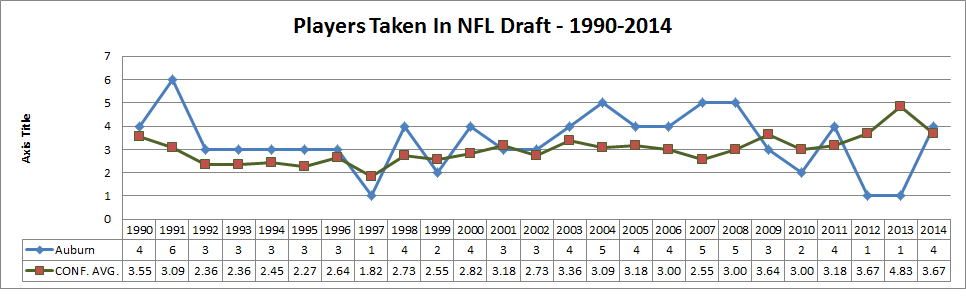
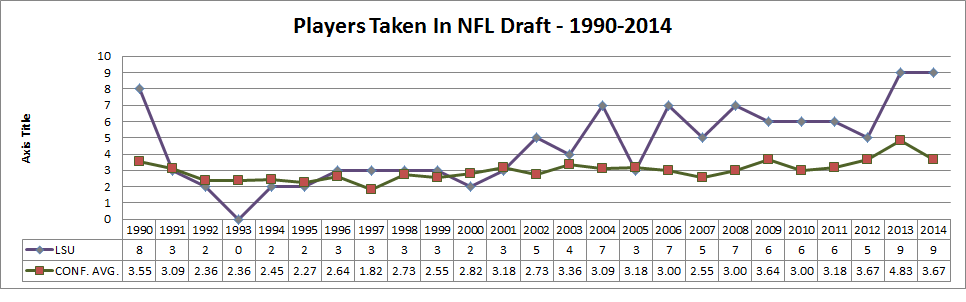
Here are select individual teams in the SEC compared to the conference average year-to-year:
Alabama:
Auburn:
LSU:
Tennessee:
Florida: