THE STATE OF OUR OPEN THREADS: 2014 IN OUR OWN DAMN WORDS
We’ve had a few weeks to process the football season for what it was now. We’ve seen the head coach under whom that season took place removed from his position. We’re on the cusp of perhaps great change, standing in the crossroads of Michigan football.
We knew it was coming. We had some words for it. Let’s take a look at some of these words.
SUMMARY DATA:
First, we’ll confine this to the words which were – for a second straight year – the major contributors to our analysis. Those are, of course, shit, fuck, damn, suck, ass and fire. The last one naturally is there to measure a certain sentiment, and we’ll get down to who that was directed at a little later.
Last year, those six words accounted for 4,654 of the 4,800 tracked instances. Because of an expanded analysis this year, we can’t do a direct comparison of sum totals, but we can compare our usage of those particular words. Surprisingly, the total only jumped to 4,888 this year for those words, about a 4% increase over last year. We could estimate, however, that we were definitely more irritated this year, albeit only slightly apparently – at least by the numbers. I dare say that in this instance it may not be a true reflection of the spleen being vented offline.
One thing that was definitely apparent was the consistency of the frustration across most games. An important indicator of this is the home / away split. Last year, 29% of our cussing was done during home games compared to 71% during away games, much of that driven by mind-numbingly bad performances at Penn State, Northwestern (despite winning) and Iowa. This year it was decidedly more even, with 41% of our swearing coming at home and 59% on the road.
The summary by tracked word is below:
| TOTAL | AVERAGE | STD. DEV. | % OF TOTAL |
"fuck" | 2003 | 166.92 | 127.91 | 37.09% |
"shit" | 895 | 74.58 | 41.82 | 16.57% |
"damn" | 383 | 31.92 | 8.37 | 7.09% |
"fire" | 692 | 57.67 | 53.40 | 12.81% |
"suck" | 485 | 40.42 | 23.43 | 8.98% |
"ass" | 430 | 35.83 | 21.41 | 7.96% |
"Morris" | 242 | 20.17 | 14.39 | 4.48% |
"Borges" | 67 | 5.58 | 3.30 | 1.24% |
"balls" | 46 | 3.83 | 3.87 | 0.85% |
"O-Line" | 157 | 13.08 | 9.07 | 2.91% |
Like last year, we relied heavily on a “fuck-shit” sort of strategy – those two words account for 53.67% of all tracked words this year. That is slightly down from 2013, where these words were nearly 60% of all tracked words, but again the analysis is slightly expanded this year. We did give fewer fucks but more shits in 2014 though, with the use of “shit” along jumping 34% from 2013.
FIRE EVERYBODY:
We’ll pull out “fire” specifically since some people might be curious about this one. We noted a 31% jump in the use of “fire” this year and over 90% of directly at Brady Hoke. You can see below the moment when, insofar as this blog is concerned, the moment when a great deal of support fell away from the last staff.
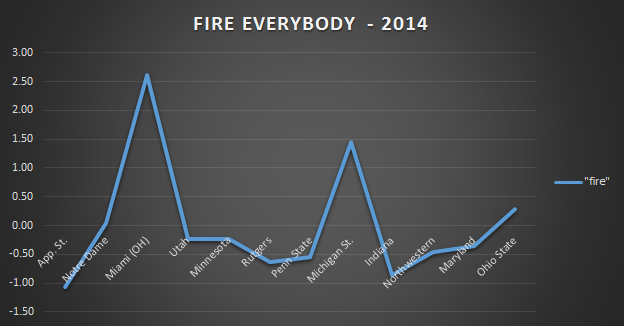
This graph shows the normalized values based on frequency of use, but clearly the Miami (OH), a game in which things that shouldn’t happen against MAC opponents did despite eventually winning, was the day I think Hoke lost most of us. For some, it was far earlier, for others perhaps later, but that game is rivaled only by the debacle at Iowa last year in terms of how badly we wanted to see someone fired, expect last year, that word was dominated by references to Al Borges.
THE FUCKS WE GAVE:
You can say what you will about the open threads becoming more of a wake for the season as things went along, but we gave a fuck. Indeed, we gave about one-quarter of all of our fucks during the Rutgers game this year. The normalized values for this are below:
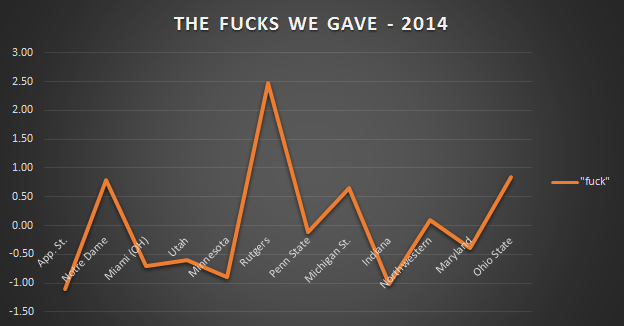
The analog to that particular game in last year’s data is Penn State, known quite rightly as “the stupidest fucking game Michigan ever played” (thanks, Ace). Rutgers as well was a game where we played well enough to win it but just could not get it together, and of course, we didn’t get a few calls here and there to boot.
The largest chunk of the remaining fucks were let loose during the Michigan State game, though this time I believe it was because the game and the season were essentially futile endeavors at that point. Like most games this season, the predominant uses of “fuck” or “fucking” were as an injection or adjective, but as might expect, use as an adjective won easily like last year.
GIVING A SHIT:
We gave some shits despite our protestations about being numb or indifferent, although we game a good deal of them early in the season during the game against Utah, which poetically ended after a weather delay with about five people in the stadium to watch us…well, you know. The normalized values are graphed below:
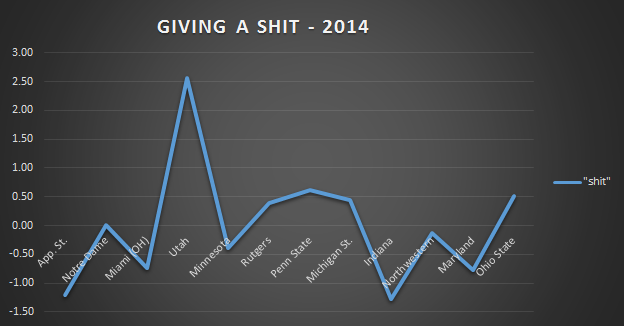
Aside from the rather stressful stretch in October, we didn’t give much after Utah. Last year, like so many things, we gave our biggest volley of shits at Iowa, which is still far and away the most hate-inducing game in the two years of this analysis.
THIS SUCKS:
We sucked. We know it. You told us. Indeed, later in the season, when it was becoming apparently that we bit the big one on most metrics, we had a good run with “suck” because it sucked. You can see that here:
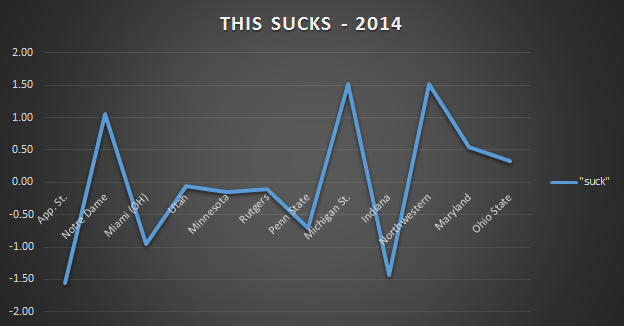
To compare that to last year, Akron and Connecticut were the games where we mentioned most of the suck. The difference here, of course, is that we really, really did this year whereas it seemed like mere underachievement in 2013.
THE OVERALL MOOD:
As you might expect, we swirled about in a land of anger and despondency when it came to our mood regarding the season. So much so, in fact, that I had to make some slight alterations to how this was measured to account for things that I didn’t really think we would see out of the season in the beginning. Admittedly, the initial template used for the data was basically last year’s template, but the spreadsheet, like its owner, learned much this past fall.
The overall chart:
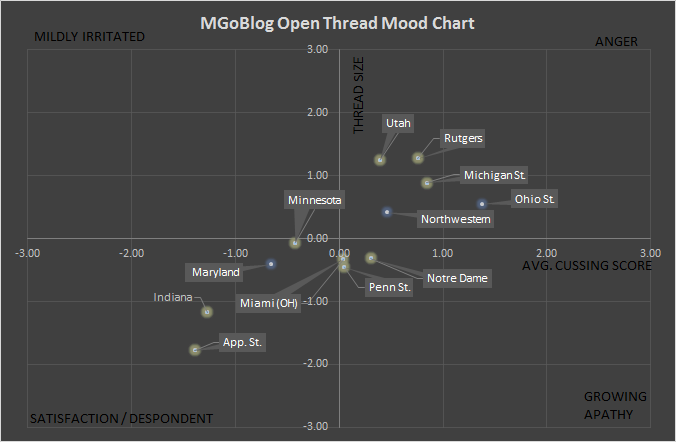
It dawned on me about halfway through the season, as you can see, that satisfaction and despondency were having the same effect on the results – low numbers of instances combined with smaller threads, the primary driver for changes in this case. There’s another reason for some of the skew in here as well, which we’ll discuss next.
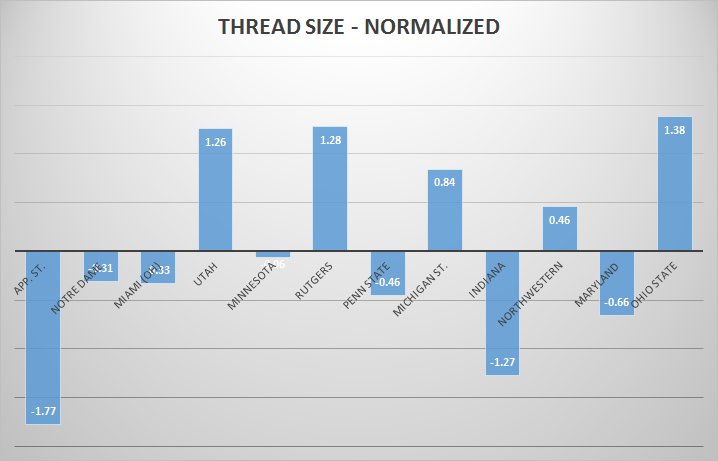
THE VOLUME OF THE SPLEEN:
Here is thread size, both summary and normalized below:
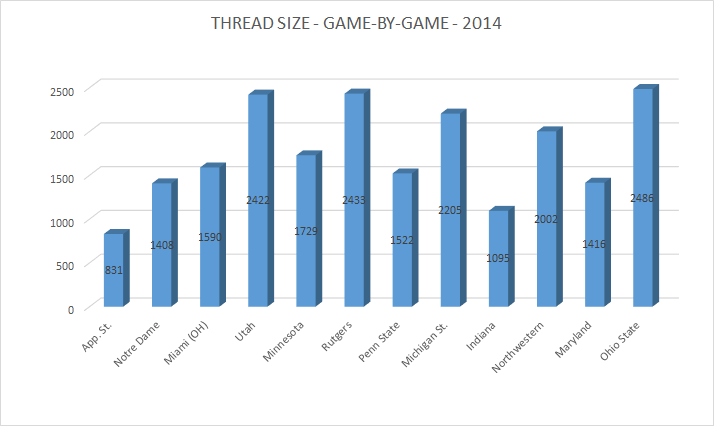
Our threads were bigger this year and much of that can be attributed to the responsibility for the liveblog being passed – due to cost – from the owners to the users. This happened early in the season and traffic restrictions on Blyve left some with little choice but to vent within the threads themselves. Some of it can also be attributed to the spike in people wanting to go on record with their opinion of Michigan’s play as well as we picked up a fair number of new users throughout the season.
SWEARING EFFICIENCY:
On the whole, we were more efficient than last year, but also more stable in our efficiency. The average swearing efficiency was 4.65 with a standard deviation of 1.93. With noted exceptions, you can see a relatively flat trend below.
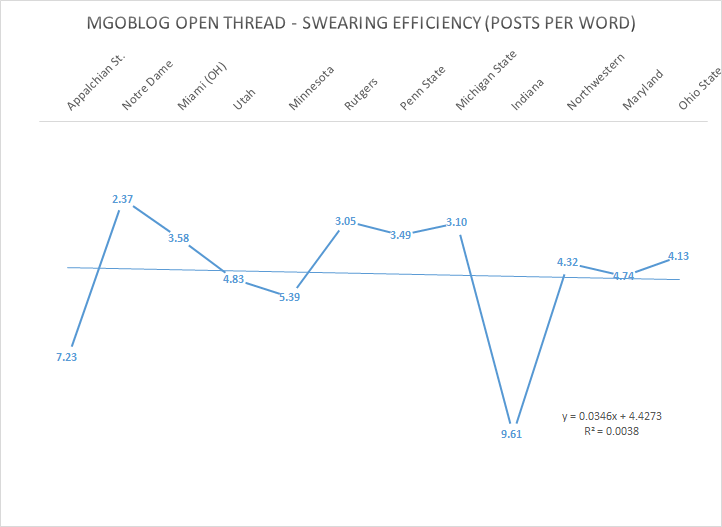
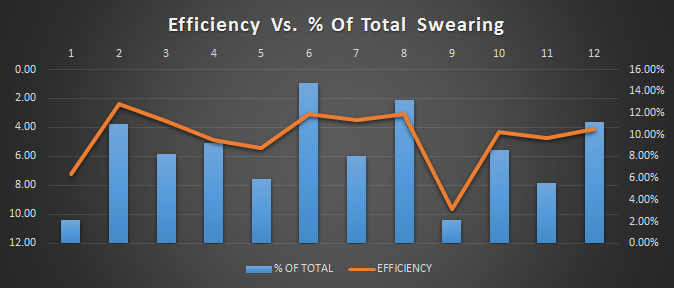
Clearly, after a certain point, we could only get so infuriated.
NORMALINZING THE ABNORMAL:
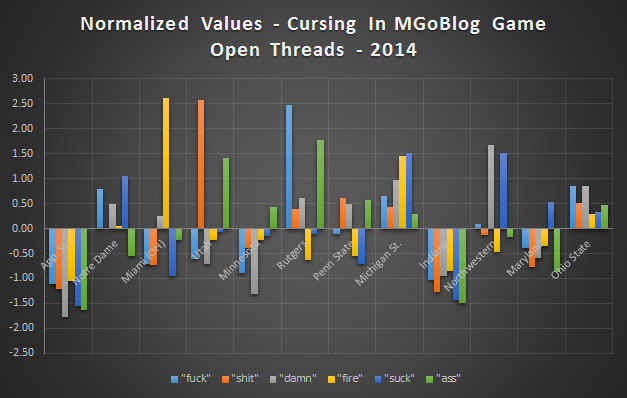
We went over some of the individual major contributors, but here is the overall chart for the major contributors. If you look at frequency here, you see something interesting actually. Most of these words had their “game”, if you will, and we discussed this a bit earlier. What it does show is that although we might have relied much on the same words overall, we did diversify the game-to-game strategy much more than last year. It was encouraging to see, for example, a lot of “shit” during Utah and “suck” during Northwestern and it was very freeing to “fire” someone at the Miami (OH) game. We did a rather good job of mixing it up in that respect.
CONCLUSION:
One thing that I only mentioned in passing about why I do this is something that I probably should have mentioned in the beginning last year. I know that, as the season dragged on, I began to get some blowback about doing the analysis, but this is how I dealt with my own frustration – by turning the whole thing into a cathartic exercise. I never had any intention of stopping it, of course, but it was my way of showing the board how frustrated I was as well. You’ll definitely see these threads next year regardless of who we hire.