SIX GAMES IN
I thought it might be a nice time to stop and look at a few basketball statistics now that we are starting to get into the season in earnest. Granted, these are non-conference games and what we will be able to get out of some of the numbers right now might be limited, but it seemed like six games was a decent enough checkpoint in the season.
One of the things which gets floated around from time to time here is the extremely good record of John Beilein once the points per possession number gets about about 1.10 or so. It is interesting then, that it has only been below that once, and that game was the very close loss to Villanova. Indeed, right now the average PPP number for Michigan is 1.22. One that I personally like as an efficiency measure is assist / turnover ratio – the season average to date is 1.95 and the only time it has been below 1.00 is also the loss to Villanova.
The comprehensive table of current averages on various stats is below:
Image may be NSFW.
Clik here to view.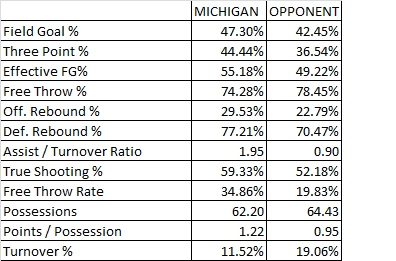
One thing that is striking to me is that, so far anyway, these numbers aren’t terribly different than many of last season’s averages. For example, last season’s eFG% overall average was 55.95% and right now it is 55.18%. The offensive rebounding percentage last season averaged 28.74%, and so far this year, it is 29.53% - a slight increase. Of course, this is not a true comparison in that you have different personnel responsible for these performances, but it seems to speak to the maturity of Beilein’s philosophy as practiced here.
There are also the Four Factors to consider. Here is what those look like after six games - naturally, we are in blue and the opponent's corresponding statistic is red:
Image may be NSFW.
Clik here to view.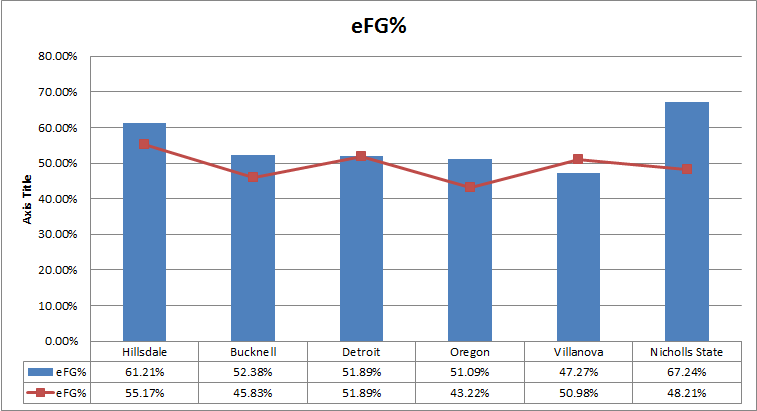 Image may be NSFW.
Clik here to view.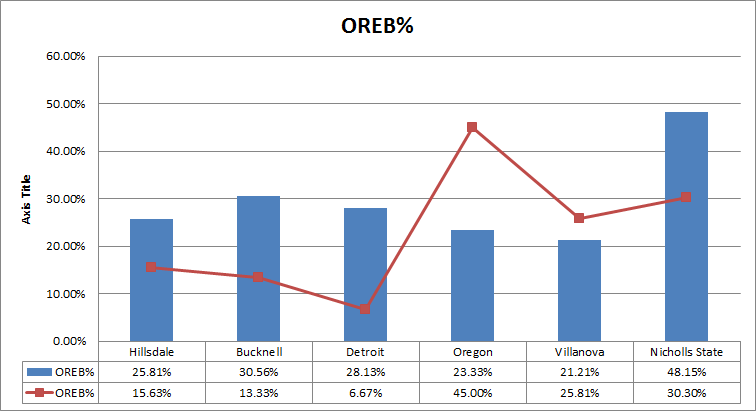 Image may be NSFW.
Clik here to view.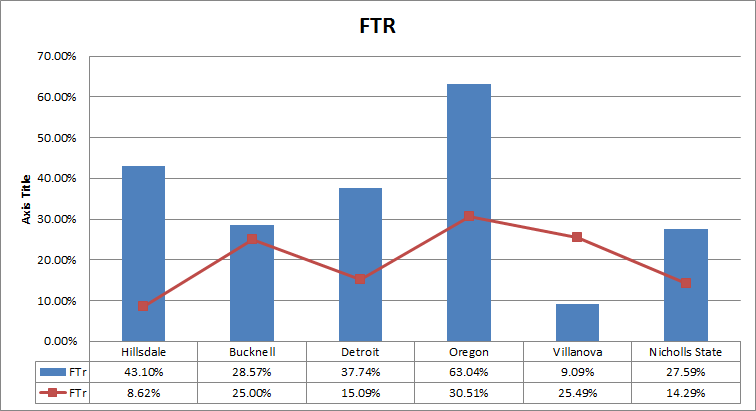 Image may be NSFW.
Clik here to view.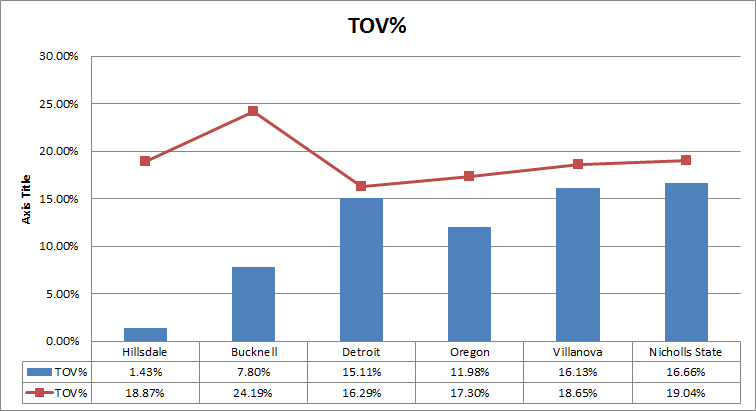
I don’t know that you can draw many strong conclusions, but the differences between the Villanova performance and the other five games are apparent. The one that I found amusing – and something that I didn’t think much about while watching the game – is the freakishly high FTR against Oregon. I don’t know that I’ve ever seen 63.04% there, but 29 FT attempts against only 46 FGs attempted is pretty amazing as a single-game stat, I think.
Anyway, here’s how it looks so far.
