Turnover analysis is always popular during the football season, but I don’t know that you often see a description of the historic luck that a team has had in turning over the ball under a particular regime, so I thought this might be an interesting route to take.
What I’ve done here is take the range of in-game turnover margins in the entirety of Hoke’s time here to date and compiled some performance and other items as it relates to each of the individual totals rather than the games. In other words, when we have had an in-game turnover margin of “+3”, for example, how did we do? How many times did we actually do that? Those are the sorts of questions we’re going to examine here.
One minor note – I did this for the regular season games only, so if you count only 46 games in these totals and wonder if stuff is missing, that would be the reason. I wanted to concentrate on our past performance against more typical OOC and conference opponents.
I took a couple approaches with the data, but first let me talk about the data.
In these 46 regular season games to date, we’ve had eight unique outcomes when it comes to turnover margin, ranging from +3 to -4. Both of those extreme performances are rare, the latter being fortunately rare – only twice in each case though. There are a few instance in here where there is an average of a small pool of numbers (I know, grumble grumble), but it is quirk of the size and the things I am attempting to demonstrate, but I say it so you can adjust your conclusions accordingly as we have an instance or two of “n” equals “not enough” perhaps. It is what it is – technical jargon there.
The first pass at this is a two-in-one sort of deal. The table below shows each achieved outcome, the win-loss record associated with it, the average scoring margin in those games, and the overall win percentage for each outcome.
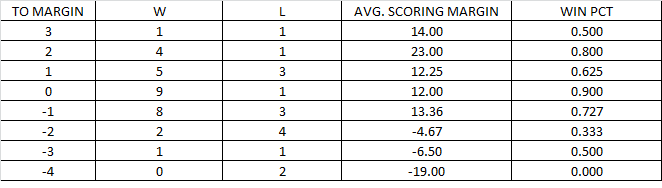
As you will note, there is some relation to turnover margin and how you perform:
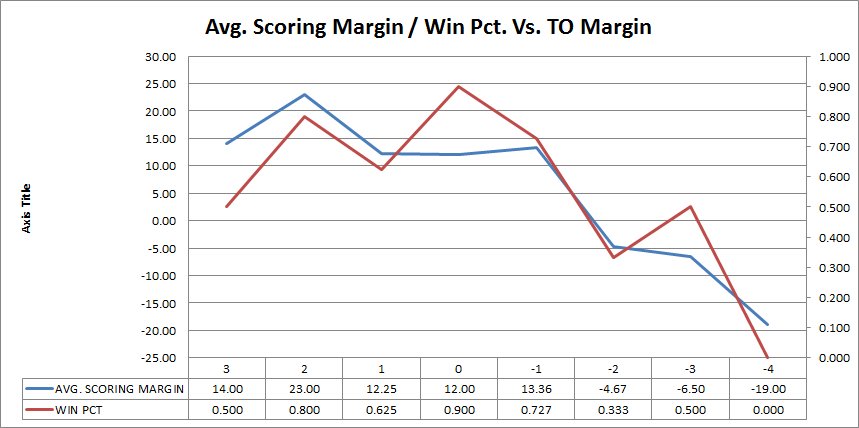
What you might be able to see here is that the relationship between turnover margin and the average margin of victory / defeat is pretty clear – the R-squared value is 0.89, in fact. The quirky nature of football (such as winning a game where you are -3 on turnovers – see above) makes the relationship to win percentage, at least in the case of Michigan, present but comparatively mild.
Here’s the distribution of the number of games at each outcome in a convenient histogram:
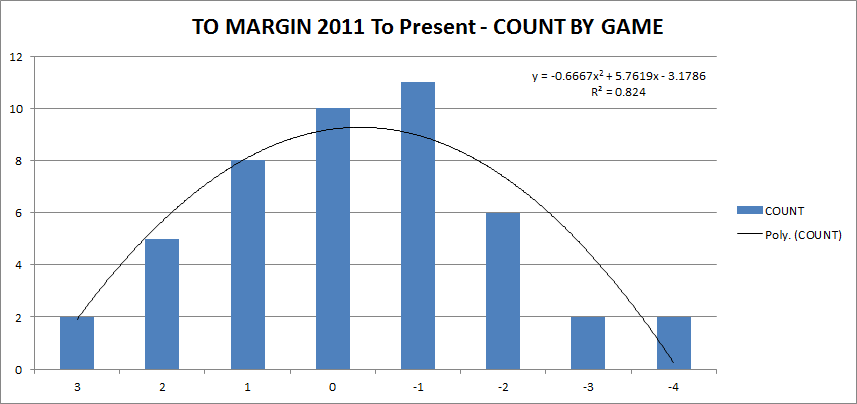
I have a feeling that a lot of teams would have a fairly similar curve, so while it the case that the most common outcome for Michigan is indeed “-1”, I would think having a majority of your games in the “1” to “-1” range isn’t uncommon at all. That being said, the overall distribution does skew ever so slightly towards the negative for Michigan – of the 46 regular season games since the start of 2011, 21 of them have had use on the short end of turnovers and 10 games were a draw on this metric.
Another look at this involved all the unique outcomes in these games when it came to the physical count of turnovers. Obviously, the best you can do is none – we’ve done that five times. The worst we’ve done, and this game is probably still a good reason to drink, is six turnovers. The table is below:
TURNOVERS | COUNT (MICH) | COUNT (OPP) |
0 | 5 | 8 |
1 | 20 | 14 |
2 | 4 | 16 |
3 | 10 | 4 |
4 | 6 | 3 |
5 | 0 | 1 |
6 | 1 | 0 |
Here’s what that looks like graphically:
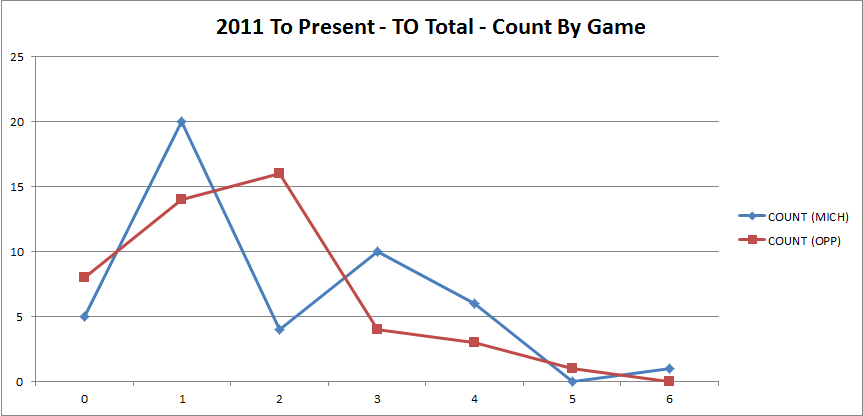
Curiously bimodal, in our case. A nice spike at “1” and another, albeit smaller one at “3”. Our opponents have generally stayed in the 1-2 per game range, which is probably something that you can say about many teams, so it likely isn’t a unique result across FBS. The interesting thing is that bimodal distribution in our numbers, as well as this:
TURNOVERS | MICH. AVG. POINTS | OPP. AVG. POINTS |
0 | 34.80 | 22.13 |
1 | 35.10 | 22.93 |
2 | 26.00 | 18.56 |
3 | 28.50 | 11.75 |
4 | 18.50 | 26.67 |
5 | NO DATA | 31.00 |
6 | 6.00 | NO DATA |
Our performance here is interesting too. Very stable between 0 and 1, as you might expect, then it drops by about nine points at 2, increases a little at 3 (because B1G mainly), then behaves more normally.
So, there’s that.