I thought we might take a moment here to look at a few differentials that normally get tracked (well, I normally track them because I am odd like this) and how they trend with scoring margin in games. We did this last year, of course, and for someone reason I called it “point differential” because I was on a roll with the word “differential” and I grew too lazy to change it. Anyway, it’s scoring margin.
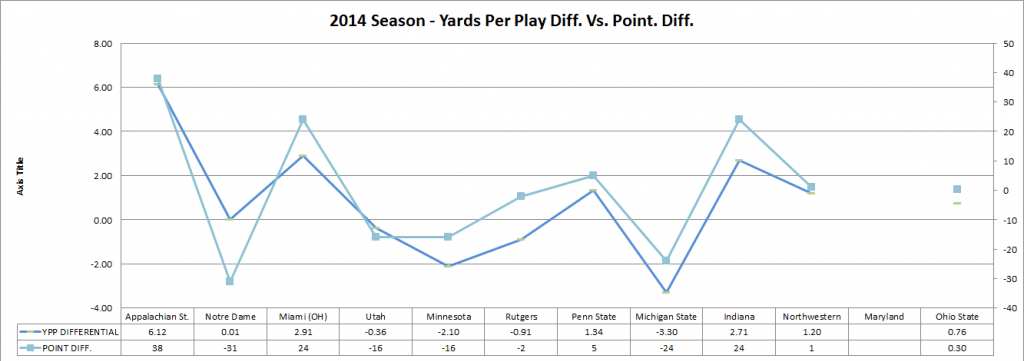
First, we’ll look at yards per play, that differential and scoring margin. You’ll be pleased to know that we do in fact, on average, outgain our opponents this year despite everything that you have seen and the ugliness of some of it. By how much? The average is all of 0.76 yards, or about 27 inches per game, so we have this going for us. The average scoring margin, which will be the same in all three charts you’ll see anyway, is 0.3 points. By the slimmest of average margins, we somehow find a way to barely win half the time in 2014, if you will.
So, with two games to go and every opportunity for what I just mentioned to be completely untrue by the end of the month, here’s where we stand with this data:
Much like last year, the worst individual performance for yards per play differentials was against Michigan State, except that this year’s number is worse than last year’s – it was -2.62 last year, and we slowed down by nearly a yard this year. Overall, you can see that the two sets of data have a decent relationship though.
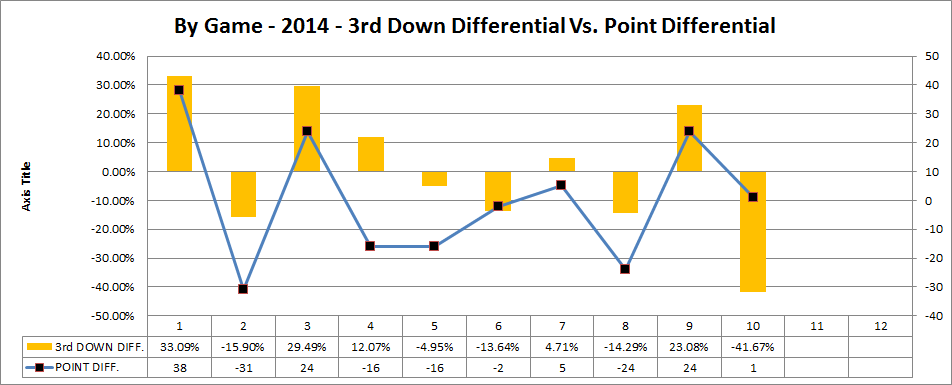
Before I introduce third down differentials, let me say that a most #B1G thing happened to us on Saturday in that ever so hideous win. We were, in fact, 41.67% LESS successful than Northwestern on converting third downs, so this is a metric where your worst individual performance in the season to date can still work out for you somehow. The average differential for the season to date on third downs is 1.20%, so we’re barely winning this one typically as well.
Here’s how that and scoring margin look together:
The relationship isn’t quite as strong as yards per play perhaps, but it is there. If you want an R-squared value for this, it is actually 0.668 (sample size…grumble grumble, of course), which is not too bad for all of the confounding factors of a football game.
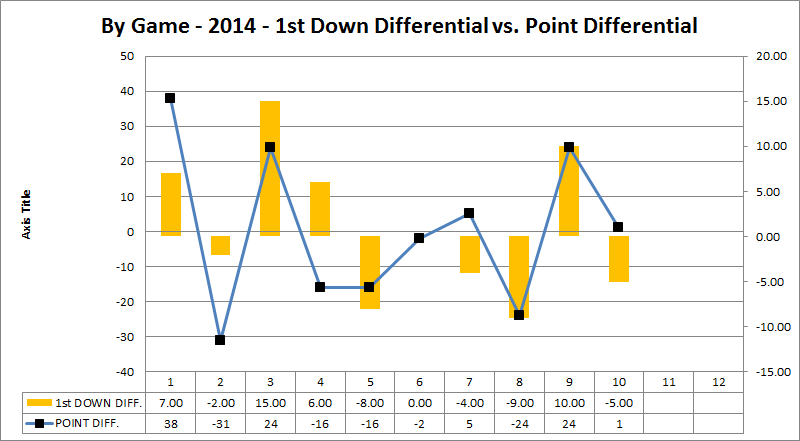
With first down differentials, we find something similar to third down. On average, we manage to get 52% of the total first downs in a game, so by the slimmest of margins again, we come out ahead here. I keep saying that in this diary – I should qualify it by saying also that there are perhaps 2-3 games which are responsible for these averages looking like they do, but this is normal in most seasons, it seems.
Anyway, here’s the first down differential charted against scoring margin:
For kicks, the R-squared on this is 0.653, so as I said, very similar to third downs.


