GETTING TO THE NEXT LEVEL
Since it is the offseason and we’re now well past the NFL Draft, I decided to do a light analysis of the relative success that the five so-called “power conferences” have had in getting players to the next level.
First, let’s just look at the last two drafts and do a quick comparison of the number of players available to be drafted and the number of players who were in fact drafted. These numbers do not include UDFAs, which would definitely supplement the statistics for each conference in a positive way.
In the 2013 and 2014 drafts, it looks like this:
Conferencce | No. Of Prospects | No. Drafted | Two-Year Pct. |
SEC | 189 | 112 | 59.26% |
ACC | 119 | 73 | 61.34% |
Big Ten | 114 | 54 | 47.37% |
Big 12 | 79 | 39 | 49.37% |
Pac-12 | 105 | 55 | 52.38% |
I found this interesting, perhaps because it wasn’t something I generally paid attention to during the draft itself. The SEC, despite having a virtual army of players available, does not have the highest percentage of players drafter here. Perhaps that is a sign that sheer quantity of pro talent has some limitations, mainly the fact that there are only so many teams and so many available slots per team.
It probably won’t shock anyone, but it is nonetheless a little discouraging – the Big Ten is the least successful conference among these five of recent note. As you’ll see, the trend is sadly one that began a while ago.
Let’s zoom out a little.
Here is the mean and standard deviation for the number of players drafted from each conference from 2000-2014, along with the overall mean and standard deviation.
Conference | MEAN | STD DEV |
SEC | 43 | 7 |
ACC | 31 | 9 |
Big Ten | 34 | 6 |
Big 12 | 27 | 5 |
Pac-12 | 30 | 3 |
OVERALL | 33 | 8 |
If you look at it like this, the Big Ten was generally successful in this time frame and a relatively steady contributor of talent to boot. The SEC wins on volume here, but in the early 2000s, the Big Ten and SEC ran somewhat neck-and-neck, as they say, when it comes to contributing players to the NFL Draft.
If we normalize the individual values for each year against their conference data, we get some intriguing trends:
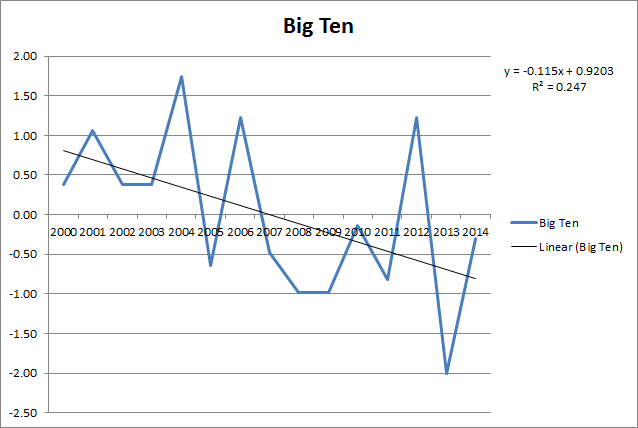
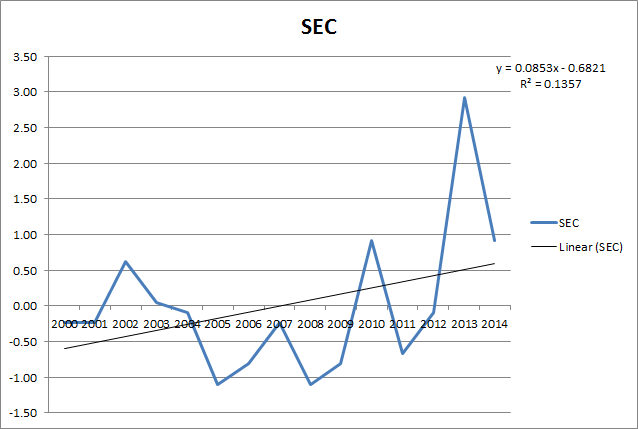
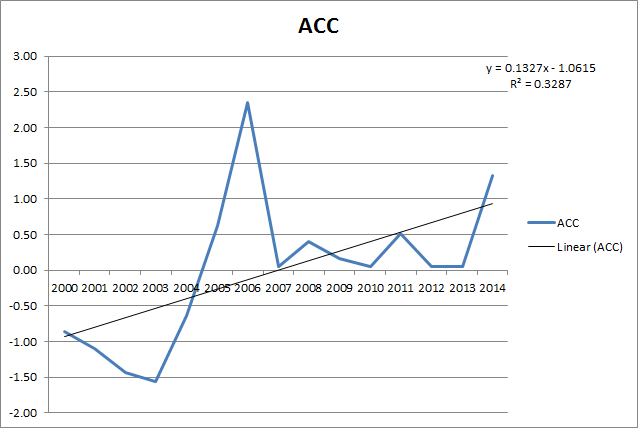
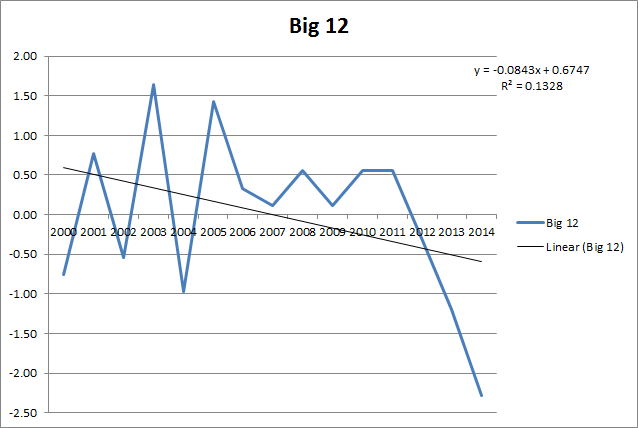
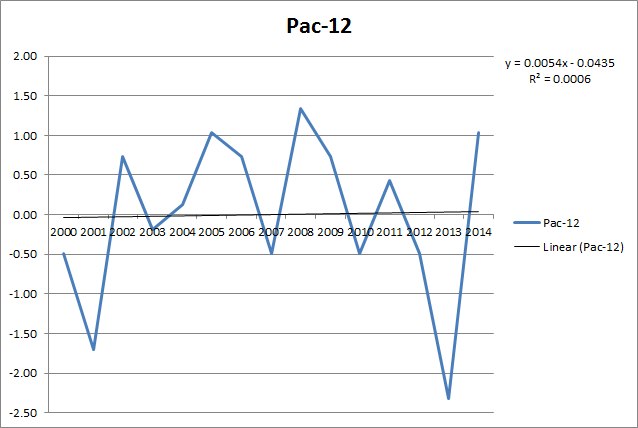
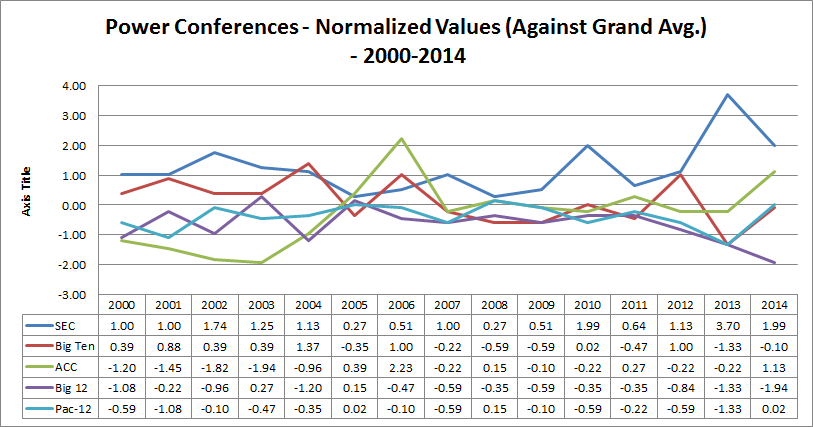
Very quickly, you should see the SEC and ACC trending upward, the Big Ten and Big 12 trending downward, and the Pac-12 sort in its own little world with an overall flat trend despite some down years in the studied period.
There are a couple things to note – the ACC went through some conference expansion around the time of that rather large spike, so there was suddenly a larger and more talented pool to draw from. The Big 12 lost Nebraska and then Texas failed to even factor into the last draft, so those were major hits to them.
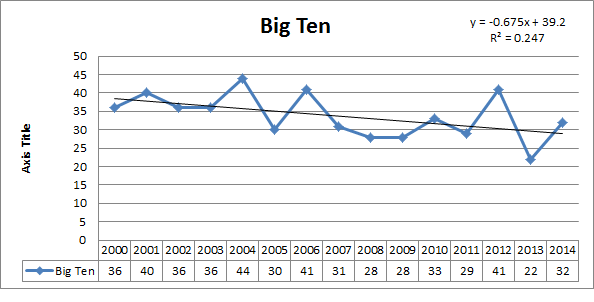
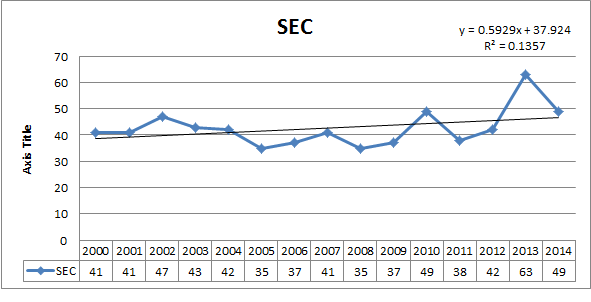
I know we’ve talked about the period between about 2007 and 2011 before when it comes to the Big Ten suffering a prolonged dry spell in relative terms, but here you can see it – in 2007, the Big Ten saw 31 players drafted, but since then, it has been as high as 41 but as low as 22. Indeed, it was less than 30 on four occasions. From 2000-2006, the least number of players that the Big Ten saw drafted was in fact 30 players. For contrast, in the entire period, the least successful years for the SEC – 2005 and 2008, saw 35 players from that conference get drafted by NFL teams.
Here is the line graph for the Big Ten and SEC, year-to-year:
CONCLUSION:
Like everything else, this is more so you can see the data and so that perhaps a little discussion can get started. I don’t presume to have the answer for the Big Ten, but the effects of the perception problem that gets discussed at length here on the blog from time to time are definitely apparent in draft results.