IMPORTANT METRICS: THIRD DOWN DIFFERENTIALS AND YARDS PER PLAY
As it is a bye week and I’ve been lax in my diary production for the last month or so because of various professional reasons, I think it is about time we took a look at the progress of Michigan on third down differentials and yards per play and how that relates to scoring margin as these things are rather highly correlated to overall team success generally.
First, some historic averages for third down differentials and scoring margin:
YEAR | AVG. 3RD DOWN DIFF. | AVG. POINT DIFF. |
2005 | 5.53% | 8.42 |
2006 | 9.89% | 13.31 |
2007 | 8.38% | 5.85 |
2008 | -11.43% | -8.67 |
2009 | 3.45% | 2.00 |
2010 | 0.28% | -2.46 |
2011 | 10.43% | 15.92 |
2012 | 16.90% | 10.00 |
2013 | 3.03% | 7.25 |
2014* | 6.41% | 0.29 |
Granted, these are teams across three different coaches, so direct comparisons of these numbers are tricky at best, but what should stand out to you, I think, are the more successful years in this period – 2006, 2011 and arguably 2007 (although it began…let’s not discuss how it began) and 2012 to some extent despite Denard DOOM at Nebraska.
Why do they stand out? If I am answering that, I would say that you see the better defenses getting stops and giving the offense every opportunity to score, but of course that offense has to function as a unit as well. For an interesting example of these stats being decoupled, look at this year – statistically, a better differential on third downs than last year, but the scoring margin is barely positive.
Here’s what the table above looks like graphically:
Image may be NSFW.
Clik here to view.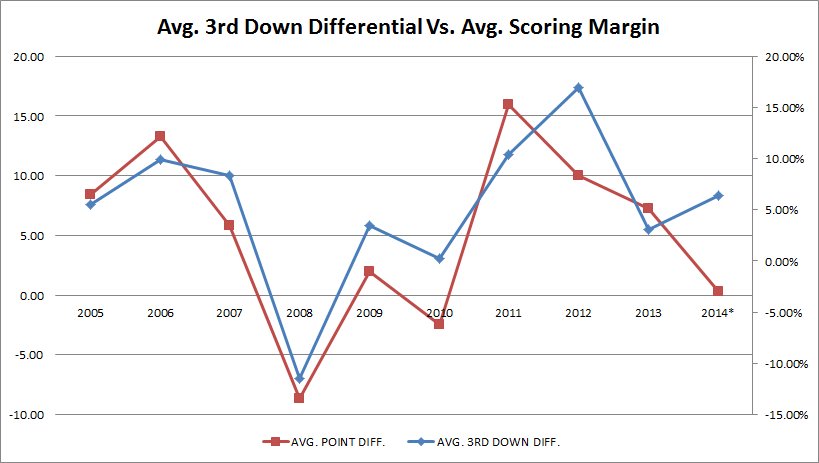
YARDS PER PLAY DIFFERENTIAL:
This one is intriguing this year, I think. When I’ve done this in the past, typically you will see scoring margin and this statistic more or less follow one another, although in close games the predictability lessens somewhat. This year, there is a bit of lag in the last few weeks between the two.
Image may be NSFW.
Clik here to view.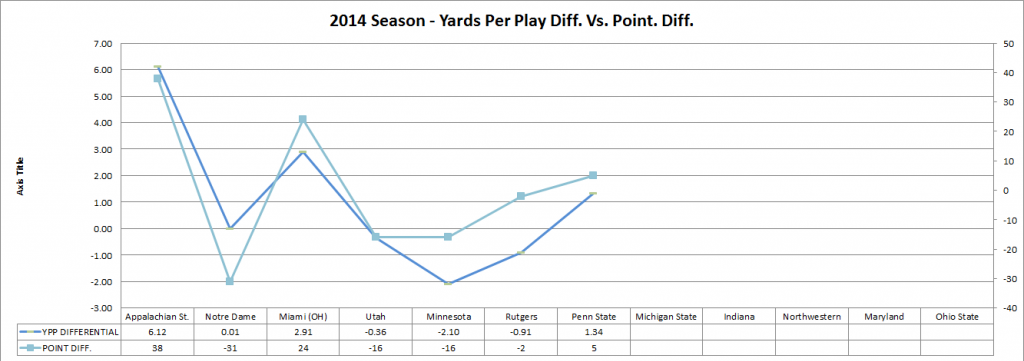
Note that only once so far have we been outpaced by more than a yard per play on average, and despite losing to Notre Dame in a morbidly spectacular manner, we outgained them by a teeny tiny bit. Teeny tiny. OK, say it was basically even.
THIRD DOWN DIFFERENTIAL IN 2014:
This follows the more traditional course when it comes to expectations – losing the third down battle makes it very difficult to win the game, of course, although it can be done. Indeed, if you look below, we did it against Utah. The opposite can also happen as well, as a matter of fact – you can lose the third down battle quite badly and still somehow win the game. Those of you who were, like I was, at the Akron game last year have seen this phenomenon in person.
Here is this year’s chart to date:
Image may be NSFW.
Clik here to view.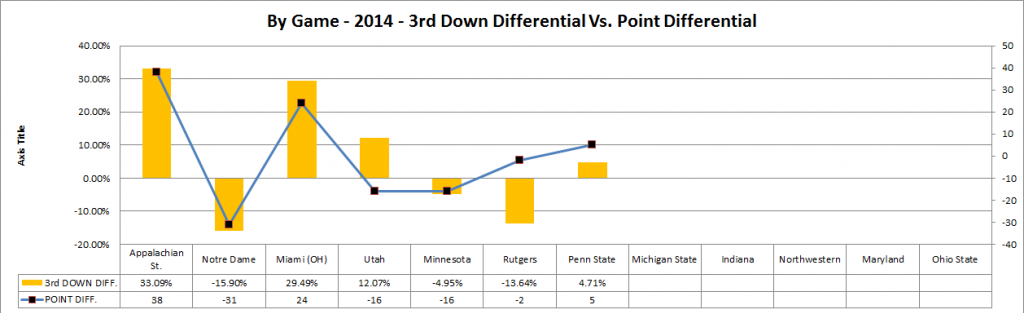
CONCLUSION:
For many reasons, this is a really weird year statistically for Michigan. More to come as the season ends, I am sure.