With the Big Ten Tournament now looming and a bid in the NIT (yes, the NIT) rather dependent on at least a decent showing in Chicago, I thought we might reflect on some of the statistical high and lows throughout the season, focusing mainly on the tempo-free stats. However, I can definitely post other metrics if you would like. Sticking with these simply keeps the size of this down.
So, let’s take a look at the four factors throughout the course of 30 games and insert the magic of conditional formatting:
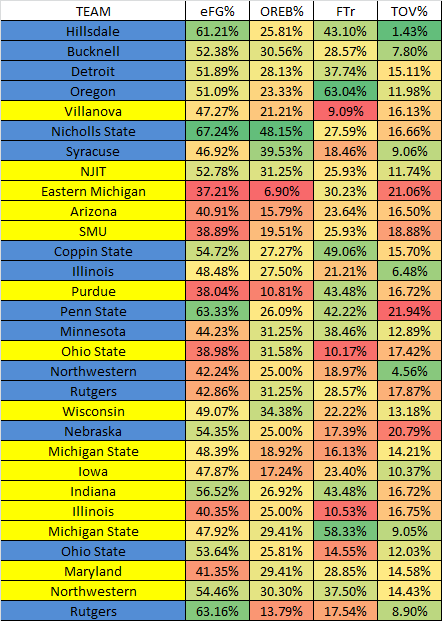
It’s best to start at the top and scroll down – wins are blue, losses are yellow in the “Team” column. It won’t tell you a story that you don’t already know, but it is interesting to see these numbers lined up with those wins and losses. Indeed, everything is going reasonably well even up to the end of the NJIT, as embarrassing as that loss was. We definitely played well enough to win that game but…well, anyway, there was the Eastern Michigan game. Simple, right?
Nope.
Take note of a few things – the EMU game was our worst performance for effective field goal percentage and offensive rebounding percentage, as well as the second worst for turnover rate (the worst performance on that metric is a game we actually won, oddly enough). From there, what follows is a rather rough stretch to end the non-conference schedule highlighted by some high turnover games by Michigan standards and rough shooting performances.
Here’s where the numbers get funny, at least in my opinion. Those first seven games of the conference schedule, where we went 5-2, our eFG% averaged 45.45%, but in the next 11 games – a stretch where Michigan was an inglorious 3-8, our eFG was 50.64%. That represented substantial improvement, if you look at individual games, but then pair that up with who you were playing and you get the idea. The other three metric were otherwise fairly stable throughout with some spot great / not-so-great performances here and there.
Below are some summary averages and some measures of variation:
CONFERENCE AVERAGES | MICHIGAN | OPPONENT | MARGIN |
Field Goal % | 41.57% | 45.60% | -4.03% |
Three Point % | 35.69% | 33.30% | 2.39% |
Effective FG% | 48.62% | 51.52% | -2.90% |
Free Throw % | 79.25% | 68.62% | 10.62% |
Off. Rebound % | 25.54% | 33.25% | -7.71% |
Def. Rebound % | 66.75% | 74.46% | -7.71% |
Assist / Turnover Ratio | 1.360 | 1.295 | 0.065 |
True Shooting % | 52.81% | 54.40% | -1.59% |
Free Throw Rate | 27.39% | 28.87% | -1.49% |
Possessions | 59.84 | 59.86 | -0.01 |
Points / Possession | 1.04 | 1.09 | -0.05 |
Turnover % | 13.83% | 15.27% | -1.44% |
Admittedly, the turnover number should have the opposite sign, but you get the idea there for the conference. Here’s the non-conference:
NON-CONFERENCE AVERAGES | MICHIGAN | OPPONENT | MARGIN |
Field Goal % | 42.55% | 44.55% | -2.00% |
Three Point % | 36.98% | 36.83% | 0.15% |
Effective FG% | 50.21% | 51.40% | -1.19% |
Free Throw % | 71.12% | 74.88% | -3.76% |
Off. Rebound % | 26.45% | 25.80% | 0.65% |
Def. Rebound % | 74.20% | 73.55% | 0.65% |
Assist / Turnover Ratio | 1.62 | 0.93 | 0.682 |
True Shooting % | 53.96% | 54.07% | -0.11% |
Free Throw Rate | 31.86% | 23.17% | 8.70% |
Possessions | 62.33 | 63.88 | -1.55 |
Points / Possession | 1.09 | 0.98 | 0.11 |
Turnover % | 13.50% | 20.16% | -6.66% |
Those actually look much better, relatively speaking, but they should since we did markedly better in some of these games, at least statistically.
You’ll see a visualization of the conference numbers in a bit (the tempo-free ones), but here are some averages with their accompanying standard deviations so you grasp the variation of play this season.
OVERALL AVERAGE / VARIATION | AVERAGE | STD. DEV. |
Field Goal % | 41.96% | 6.62% |
Three Point % | 36.21% | 10.79% |
Effective FG% | 49.26% | 7.90% |
Free Throw % | 76.00% | 13.22% |
Off. Rebound % | 25.90% | 8.12% |
Def. Rebound % | 69.73% | 9.73% |
Assist / Turnover Ratio | 1.46 | 0.94 |
True Shooting % | 53.27% | 7.88% |
Free Throw Rate | 29.18% | 13.65% |
Possessions | 60.84 | 4.04 |
Points / Possession | 1.06 | 0.18 |
Turnover % | 13.70% | 4.82% |
BIG TEN AVERAGE / VARIATION | AVERAGE | STD. DEV. |
Field Goal % | 41.57% | 6.31% |
Three Point % | 35.69% | 9.69% |
Effective FG% | 48.62% | 7.46% |
Free Throw % | 79.25% | 12.95% |
Off. Rebound % | 25.54% | 6.27% |
Def. Rebound % | 66.75% | 7.14% |
Assist / Turnover Ratio | 1.36 | 0.89 |
True Shooting % | 52.81% | 7.25% |
Free Throw Rate | 27.39% | 13.22% |
Possessions | 59.84 | 4.31 |
Points / Possession | 1.04 | 0.13 |
Turnover % | 13.83% | 4.55% |
One that strikes me is the variation in A/T ratio. Throughout the season, Michigan averaged 11.3 assists per game with a standard deviation of nearly 4 assists, which to me seems fairly significant. Michigan averaged 9.6 turnovers per game with a standard deviation of a shade more than 3 turnovers, which is significant to me as well. I say that because I then dragged my eyes over to the scoring margin column (which I can post) and it turns out that their average margin of victory / loss is 0.43 points. They are the epitome of a 0.500 team in some ways, at least by the numbers.
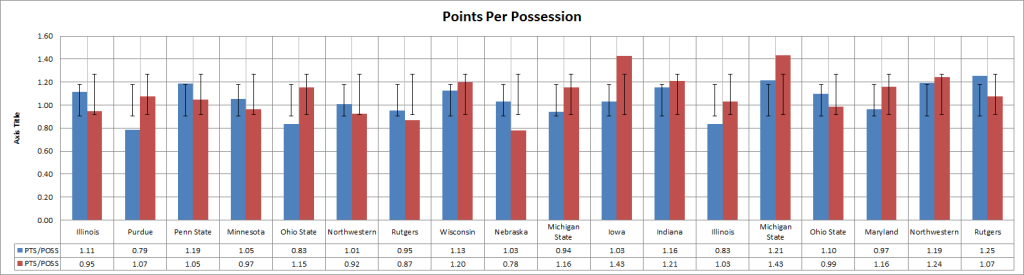
Points per possession is another interesting one. For just scoring, consider that Michigan averaged 64.5 point per game with a standard deviation of 11.9 (say, 12) points. That to me is the result of the scoring droughts and the inconsistency in a nutshell, but then you combine with considerable variation elsewhere and it provides support for something we asked quite a bit this year – “Which Michigan will show up today?”
Granted, when your bench depth is now starting and two key starters are out and when you turn around and realize that a workable rotation is not something that will be easy to, well, work, it seems like things like this begin to happen.
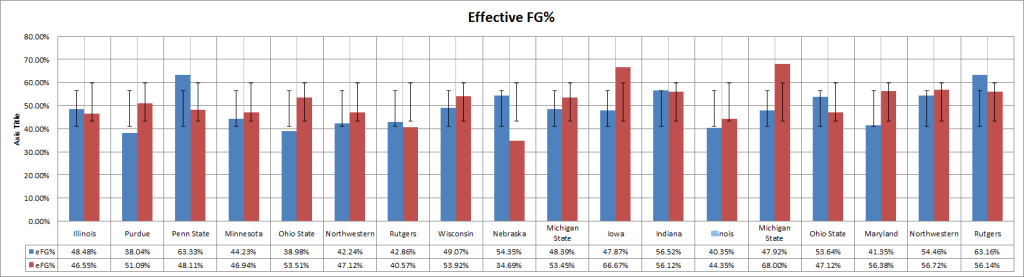
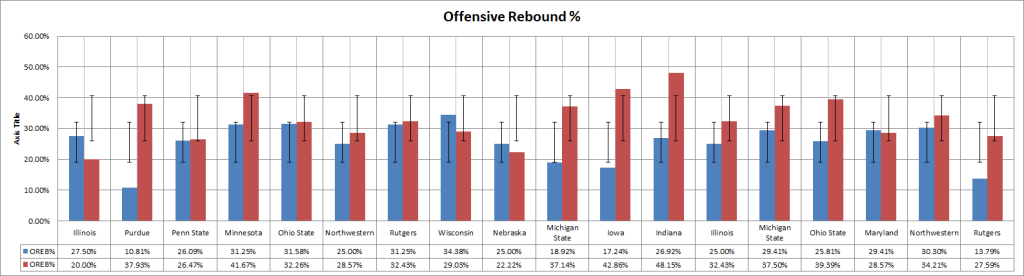
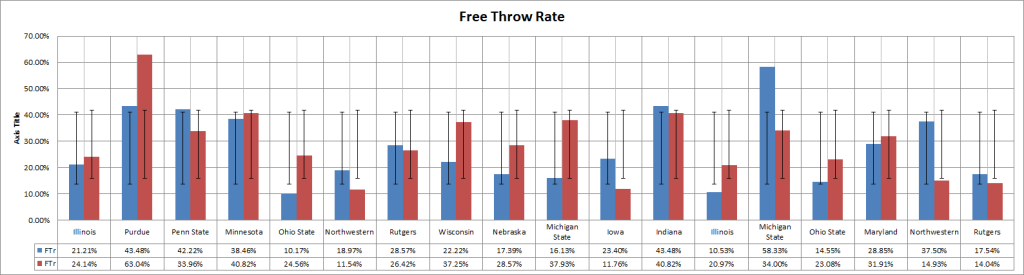
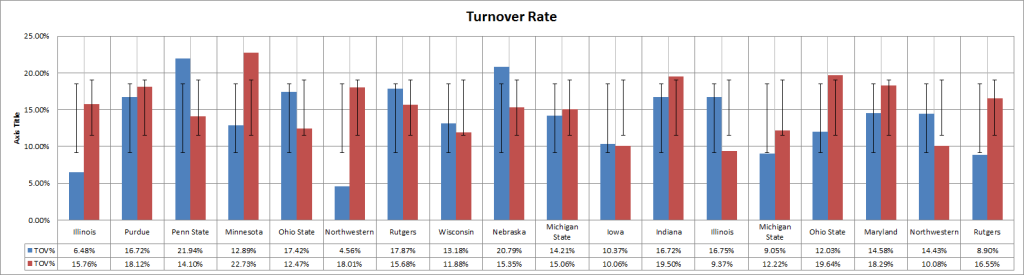
Here’s a better visualization of some of the variation in conference play - the four factors are below, but you can see plus / minus one standard deviation marked via the addition of “error bars”, which in this case aren’t really doing what they normally might, but whatever, eh?
For the full size images, you may need to invade my Photobucket space here (LINK). Megagraphs and diaries don't mix.
Here’s points per possession too:
In conclusion: